
Some people wonder why their google analytics speed chart looks like 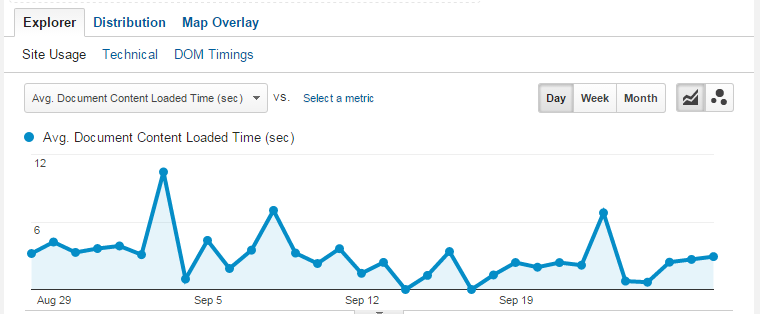
this although the server speed should be pretty continuous.
Well, there is an easy explanation and a very easy fix for this.
The reason for this choppy chart is that google by default takes only every 100th pageview into account. This means: If you have a small site with let’s say about a 1,000 pageviews per day only 10 samples are used to calculate your speed. If these 10 pageviews were by chance initiated by very slow smartphones or tablets your site speed may look very bad although all other 990 pageviews may have been pretty fast.
How do we solve this?
We just have to tell google to collect more speed data from our site. For this we add a litte parameter to our google analytics code snippet:
(function(i,s,o,g,r,a,m){i['GoogleAnalyticsObject']=r;i[r]=i[r]||function(){
    (i[r].q=i[r].q||[]).push(arguments)},i[r].l=1*new Date();a=s.createElement(o),
    m=s.getElementsByTagName(o)[0];a.async=1;a.src=g;m.parentNode.insertBefore(a,m)
    })(window,document,'script','//www.google-analytics.com/analytics.js','ga');
    ga('create', '<?=GA_TID?>', 'auto');
    ga('send', 'pageview');
(function(i,s,o,g,r,a,m){i['GoogleAnalyticsObject']=r;i[r]=i[r]||function(){
(i[r].q=i[r].q||[]).push(arguments)},i[r].l=1*new Date();a=s.createElement(o),
m=s.getElementsByTagName(o)[0];a.async=1;a.src=g;m.parentNode.insertBefore(a,m)
})(window,document,'script','//www.google-analytics.com/analytics.js','ga');
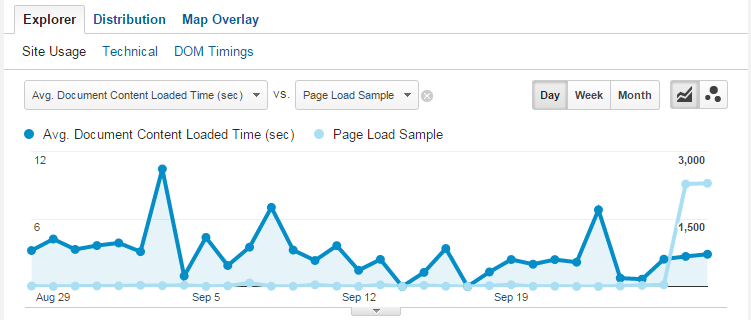
ga('create', '<?=GA_TID?>', {'siteSpeedSampleRate': 100});
ga('send', 'pageview');
The 'siteSpeedSampleRate': 100 parameter tells google to use 100% of the pageviews for speed calculations. This percent rate can be anything between 0 and 100.
When we enable the Page Load Sample metric in the Site Speed Page Timings report we see the result of the change:
Leave a Reply